
11% Growth in Service Revenue, 31% in Net Income, 12% in Adjusted EBITDA, 2.1 Million Customer Net Additions and Record-Low Fourth Quarter Churn of 1.28% in Q4
Fourth Quarter and Full-Year 2016 Highlights:
Industry-leading customer growth:
- 2.1 million total net additions in Q4 2016 - 8.2 million in 2016
- 1.2 million total branded postpaid net additions - 4.1 million in 2016
- 933,000 branded postpaid phone net additions in Q4 2016 - 3.3 million in 2016
- 541,000 branded prepaid net additions in Q4 2016 - 2.5 million in 2016
- 1.28% branded postpaid phone churn in Q4 2016, down 18 bps from Q4 2015 - 1.30% in 2016, down 9 bps from 2015
Industry-leading financial growth (all percentages year-over-year):
- $7.2 billion service revenues, up 11% in Q4 2016 - up 12% to $27.8 billion in 2016
- $10.2 billion total revenues, up 23% in Q4 2016 - up 16% to $37.2 billion in 2016
- $390 million net income, up 31% in Q4 2016 - up 99% to $1.5 billion in 2016
- $0.45 EPS, up 32% in Q4 2016 - $1.69 EPS, up 106% in 2016
- $2.5 billion Adjusted EBITDA(1), up 12% in Q4 2016 - up 41% to $10.4 billion in 2016
Strong outlook for 2017:
- Guidance range for branded postpaid net additions of 2.4 to 3.4 million
- Net income is not available on a forward looking basis(2)
- Adjusted EBITDA target of $10.4 to $10.8 billion, which excludes spectrum gains and includes leasing revenues of $0.8 to $0.9 billion. The impact from Data Stash is expected to be immaterial.
- Cash capital expenditures guidance of $4.8 to $5.1 billion, excluding capitalized interest
- Net cash provided by operating activities three-year compound annual growth rate (CAGR) is expected to be between 15% and 18%
- Free Cash Flow three-year CAGR is expected to be between 45% and 48%(1)
__________________________________
- Adjusted EBITDA is a non-GAAP financial measure and Free Cash Flow is a non-GAAP financial metric. These non-GAAP financial items should be considered in addition to, but not as a substitute for, the information provided in accordance with GAAP. Reconciliations for these non-GAAP financial items to the most directly comparable GAAP financial items are provided in the financial tables.
- T-Mobile is not able to forecast net income on a forward looking basis without unreasonable efforts due to the high variability and difficulty in predicting certain items that affect GAAP net income including, but not limited to, income tax expense, stock based compensation expense, interest expense and interest income.
BELLEVUE, Wash. - February 14, 2017 - T-Mobile US, Inc. (NASDAQ: TMUS) reported Q4 2016 results which showed that T-Mobile continues to lead the industry in both customer and financial growth.
For the third year in a row, the Company added more than 8 million total customers and captured all of the industry's postpaid phone growth by adding 3.3 million branded postpaid phone customers in 2016. In prepaid, the Company added more than 5 million net additions over the past 3 years, including 2.5 million in 2016. T-Mobile also completed its third year of growing service revenues, recording 12% growth in 2016 when all of its peers showed declines. This consistent outperformance continues to distinguish T-Mobile from the pack in wireless and the outlook for 2017 shows that the Company plans to continue with strong growth in customers and financial metrics.
"These results are proof that doing right by customers is also good for shareholders. Not only are customers flocking to T-Mobile, but we're also producing rock-solid financial results including 11% growth in service revenues, 23% in total revenues, 31% in net income and 12% in Adjusted EBITDA year-over-year in Q4,” said John Legere, President and CEO of T-Mobile. “The competition just doesn't get that customers want to come first! That's three years in a row that we've added more than 8 million customers and taken all of the postpaid phone growth in the industry. The Un-carrier revolution continues in 2017!"
Industry-Leading Customer Growth
T-Mobile’s Un-carrier strategy has upended the wireless industry and is built around listening to customers and finding solutions for their pain points. This has resulted in a series of consumer-friendly moves that changed the rules of wireless and forced the competition to change along with it. So far, T-Mobile has launched 13 Un-carrier moves in just four years including the elimination of service contracts, ending overages, enabling upgrades anytime, free international data roaming, unlimited music and video streaming, and offering all unlimited plans with taxes and fees included. The Un-carrier’s momentum has become a consumer revolution that sets T-Mobile far apart from the competition… with results to match.

- Total net customer additions were 2.1 million in Q4 2016, bringing the Company's total customer count to 71.5 million. This was the 15th consecutive quarter in which T-Mobile generated more than 1 million total net customer additions. For full-year 2016, total net additions were 8.2 million marking the third year in a row of more than 8 million.
- Branded postpaid net additions were 1.2 million in Q4 2016. For full-year 2016, branded postpaid net customer additions were 4.1 million, well above the revised guidance for branded postpaid net customer additions of 3.7 to 3.9 million provided in connection with the Q3 2016 earnings.
- Branded postpaid phone net additions were 933,000 in Q4 2016, marking the 12th consecutive quarter that T-Mobile has led the industry in branded postpaid phone net additions. For full-year 2016, T-Mobile added 3.3 million branded postpaid phone customers, capturing all of the industry's growth for the third consecutive year. Branded postpaid phone churn was a fourth quarter record of 1.28% in Q4 2016, down 4 basis points from Q3 2016 and down 18 basis points from Q4 2015. For full-year 2016, branded postpaid phone churn was 1.30%, down 9 basis points.
- Branded prepaid net additions were 541,000 in Q4 2016, which once again led the industry driven by the continued success of the MetroPCS brand. For full-year 2016, branded prepaid net additions were 2.5 million, which was the best annual performance in Company history. Branded prepaid churn was 3.94% in Q4 2016, up 12 basis points from Q3 2016 and down 26 basis points from Q4 2015. For full-year 2016, branded prepaid churn was a record-low 3.88%, down 57 basis points from full-year 2015.
- Wholesale net additions were 363,000 in Q4 2016 and 1.6 million in full-year 2016. Going forward, T-Mobile expects wholesale net additions to be significantly lower in 2017, as the Company’s MVNO partners de-emphasize Lifeline in favor of higher ARPU customer categories.
Industry-Leading Financial Growth
T-Mobile’s Un-carrier strategy is also producing the strongest financial growth in the industry. From the outset, the company has focused on translating its incredible customer growth into revenue, net income, Adjusted EBITDA, net cash provided by operating activities and free cash flow growth - and that’s clearly showing up in its 2016 results. T-Mobile closed the year strong and was the only company growing service revenues year-over-year in Q4 while the competition was negative.

- Service revenues increased by 11% in Q4 2016 to $7.2 billion. This marks the 11th consecutive quarter that T-Mobile has led the industry in year-over-year service revenue percentage growth. For full-year 2016, service revenues increased by 12% to $27.8 billion. This marks the third consecutive year that T-Mobile has led the industry in service revenue percentage growth. Total revenues increased by 23% in Q4 2016 to $10.2 billion. This marks the 14th time in the past 15 quarters that T-Mobile has led the industry in total revenue percentage growth. For full-year 2016, total revenues increased by 16% to $37.2 billion. This marks the third consecutive year that T-Mobile has led the industry in total revenue percentage growth.
- Branded postpaid phone Average Revenue per User (ARPU) was $48.37 in Q4 2016, up 0.7% from Q4 2015. For full-year 2016, branded postpaid phone ARPU was $47.47, down 0.4% from 2015.
- Net income increased by 31% year-over-year in Q4 2016 to $390 million. For full-year 2016, net income increased by 99% to $1.5 billion. Excluding spectrum gains, the year-over-year and full-year growth in net income was 84% and 50%, respectively. Net income, excluding spectrum gains, as a percentage of service revenue was 3.4% in 2016, up from 2.6% in 2015. Diluted Earnings per share (EPS) increased by $0.11 year-over-year in Q4 2016 to $0.45. The after-tax impact on EPS of spectrum gains was $0.10 in Q4 2015. For full-year 2016, diluted EPS increased by $0.87 to $1.69, up 106% from 2015. The after-tax impact on EPS of spectrum gains was $0.62 in 2016 and $0.12 in 2015.
- Adjusted EBITDA increased by 12% year-over-year in Q4 2016 to $2.5 billion. For full-year 2016, Adjusted EBITDA increased by 41% to $10.4 billion. Excluding spectrum gains, the year-over-year and full-year growth in Adjusted EBITDA was 19% and 32%, respectively. Adjusted EBITDA margin, excluding spectrum gains, was 34% in 2016, up from 29% in 2015.
- Cash capital expenditures reflect the Company’s continued investment in the expansion of its 4G LTE network. In Q4 2016, cash capital expenditures, excluding capitalized interest, were $0.8 billion. Cash capital expenditures included capitalized interest of $71 million in Q4 2016, $17 million in Q3 2016 and $50 million in Q4 2015. For full-year 2016, cash capital expenditures, excluding capitalized interest, were $4.6 billion, up from $4.5 billion in 2015. Cash capital expenditures included capitalized interest of $142 million and $246 million, respectively.
- Net cash provided by operating activities was $1.6 billion in Q4 2016, a decrease of $631 million year-over-year. For full-year 2016, net cash provided by operating activities was $6.1 billion, an increase of $721 million from 2015. Free cash flow decreased $59 million to $743 million in Q4 2016. For full-year 2016, free cash flow increased $743 million to $1.4 billion.
Fastest and Fastest Growing 4G LTE Network
T-Mobile currently provides 4G LTE coverage to 314 million people, and is targeting to provide 320 million people with 4G LTE coverage by year-end 2017. The Company continues to increase the depth, breadth and functionality of its LTE network by adding new spectrum to increase coverage, and re-farming existing spectrum and implementing new technology to augment capacity. Collectively, these network advancements help provide even further improved network performance and reliability for T-Mobile's customers.
At the end of Q4 2016, T-Mobile owned or had agreements to own an average of 86 MHz of spectrum across the top 25 markets in the U.S. In Q4 2016, T-Mobile closed on the previously announced Chicago 700 MHz A-Block transaction, and in Q1 2017 the Company closed on the previously announced Eastern Montana 700 MHz A-Block transaction, bringing its total low-band spectrum holdings to 272 million POPs. T-Mobile has deployed its 700 MHz A-Block spectrum in over 500 market areas covering more than 252 million people under the name “Extended Range LTE” to enhance coverage and in-building performance for its customers.
T-Mobile continues to expand its capacity through the re-farming of existing spectrum and implementation of new technologies to support current and future customer growth. At the end of Q4 2016, approximately 70% of spectrum was being used for 4G LTE compared to 52% at the end of Q4 2015. The Company expects to continue to re-farm spectrum currently committed to 2G and 3G technologies. Re-farmed spectrum enables T-Mobile to continue expanding Wideband LTE, which currently covers 232 million people. During Q4 and throughout 2016, the Company has deployed and expanded new technologies like VoLTE, Carrier Aggregation, and 4x4 MIMO that have delivered material capacity benefits to both customers and the T-Mobile network.
All of these improvements have enabled T-Mobile’s 4G LTE network to become the fastest in the nation based on both download and upload speeds from millions of user-generated tests. This is the twelfth consecutive quarter that the Company has held that title.
2017 Outlook
T-Mobile’s 2017 guidance shows that the Company plans to continue with strong growth in customers, Adjusted EBITDA, net cash provided by operating activities and free cash flow. In 2017, T-Mobile expects to add between 2.4 and 3.4 million branded postpaid net additions. While Net income is not available on a forward looking basis, the Company is targeting between $10.4 and $10.8 billion in Adjusted EBITDA, which excludes spectrum gains and includes leasing revenues of $0.8 to $0.9 billion (the impact from Data Stash is expected to be immaterial). Cash capital expenditures guidance is $4.8 to $5.1 billion, excluding capitalized interest. Net cash provided by operating activities three-year CAGR is expected to be between 15% and 18%. Free Cash Flow three-year CAGR is expected to be between 45% and 48%.
Financial Results
For more details on T-Mobile’s Q4 2016 and full-year 2016 financial results, including the Investor Factbook with detailed financial tables and reconciliations of certain historical non-GAAP measures disclosed in this release to the most comparable measures under GAAP, please visit T-Mobile US, Inc.'s Investor Relations website at http://investor.T-Mobile.com.
T-Mobile Social Media
Investors and others should note that the Company announces material financial and operational information to its investors using its investor relations website, press releases, SEC filings and public conference calls and webcasts. The Company also intends to use the @TMobileIR Twitter account (https://twitter.com/TMobileIR) and the @JohnLegere Twitter (https://twitter.com/JohnLegere), Facebook and Periscope accounts, which Mr. Legere also uses as a means for personal communications and observations, as means of disclosing information about the Company and its services and for complying with its disclosure obligations under Regulation FD. The information we post through these social media channels may be deemed material. Accordingly, investors should monitor these social media channels in addition to following the Company’s press releases, SEC filings and public conference calls and webcasts. The social media channels that the Company intends to use as a means of disclosing the information described above may be updated from time to time as listed on the Company’s investor relations website.
About T-Mobile US, Inc.
As America's Un-carrier, T-Mobile US, Inc. (NASDAQ: TMUS) is redefining the way consumers and businesses buy wireless services through leading product and service innovation. The Company's advanced nationwide 4G LTE network delivers outstanding wireless experiences to 71.5 million customers who are unwilling to compromise on quality and value. Based in Bellevue, Washington, T-Mobile US provides services through its subsidiaries and operates its flagship brands, T-Mobile and MetroPCS. For more information, please visit https://www.t-mobile.com or join the conversation on Twitter using $TMUS.
Q4 2016 and Full-Year 2016 Earnings Call, Livestream and Webcast Access Information
Access via Phone (audio only):
Date: February 14, 2017 Time: 10:00 a.m. (EST) Call-in Numbers: 800-432-9830 International: 719-234-7318 Participant Passcode: 3231453Please plan on accessing the earnings call ten minutes prior to the scheduled start time.
Access via Social Media:
The @TMobileIR Twitter account will live-tweet the earnings call.
Submit Questions via Text, Twitter, or Facebook:
Text: Send a text message to 313131, enter the keyword TMUS followed by a space Twitter: Send a tweet to @TMobileIR or @JohnLegere using $TMUS Facebook: Post a comment to John Legere’s Facebook Earnings postAccess via Webcast:
The earnings call will be broadcast live via the Company's Investor Relations website at http://investor.t-mobile.com. A replay of the earnings call will be available for two weeks starting shortly after the call concludes and can be accessed by dialing 888-203-1112 (toll free) or 719-457-0820 (international). The passcode required to listen to the replay is 8628938.
To automatically receive T-Mobile financial news by e-mail, please visit the T-Mobile Investor Relations website, http://investor.t-mobile.com, and subscribe to E-mail Alerts.
Forward-Looking Statements
This news release includes "forward-looking statements" within the meaning of the U.S. federal securities laws. Any statements made herein that are not statements of historical fact, including statements about T-Mobile US, Inc.'s plans, outlook, beliefs, opinions, projections, guidance, strategy, expected network modernization and other advancements, are forward-looking statements. Generally, forward-looking statements may be identified by words such as "anticipate," "expect," "suggests," "plan," “project,” "believe," "intend," "estimates," "targets," "views," "may," "will," "forecast," and other similar expressions. The forward-looking statements speak only as of the date made, are based on current assumptions and expectations, and involve a number of risks and uncertainties. Important factors that could affect future results and cause those results to differ materially from those expressed in the forward-looking statements include, among others, the following: adverse economic or political conditions in the U.S. and international markets; competition in the wireless services market, including new competitors entering the industry as technologies converge; the effects any future merger or acquisition involving us, as well as the effects of mergers or acquisitions in the technology, media and telecommunications industry; challenges in implementing our business strategies or funding our wireless operations, including payment for additional spectrum or network upgrades; the possibility that we may be unable to renew our spectrum licenses on attractive terms or acquire new spectrum licenses at reasonable costs and terms; difficulties in managing growth in wireless data services, including network quality; material changes in available technology; the timing, scope and financial impact of our deployment of advanced network and business technologies; the impact on our networks and business from major technology equipment failures; breaches of our and/or our third party vendors’ networks, information technology and data security; natural disasters, terrorist attacks or similar incidents; existing or future litigation; any changes in the regulatory environments in which we operate, including any increase in restrictions on the ability to operate our networks; any disruption or failure of our third parties’ or key suppliers’ provisioning of products or services; material adverse changes in labor matters, including labor campaigns, negotiations or additional organizing activity, and any resulting financial, operational and/or reputational impact; the ability to make payments on our debt or to repay our existing indebtedness when due; adverse change in the ratings of our debt securities or adverse conditions in the credit markets; changes in accounting assumptions that regulatory agencies, including the Securities and Exchange Commission (“SEC”), may require, which could result in an impact on earnings; and changes in tax laws, regulations and existing standards and the resolution of disputes with any taxing jurisdictions; and other risks described in our filings with the SEC, including those described in our most recently filed Annual Report on Form 10-K. You should not place undue reliance on these forward-looking statements. We do not undertake to update forward-looking statements, whether as a result of new information, future events or otherwise, except as required by law.
Press Contact: Investor Relations Contact: Media Relations Nils Paellmann T-Mobile US, Inc. T-Mobile US, Inc. [email protected] 877-281-TMUS or 212-358-3210 http://newsroom.t-mobile.com [email protected] http://investor.t-mobile.comReconciliation of Non-GAAP Financial Measures to GAAP Financial Measures
(Unaudited)
This Press Release includes non-GAAP financial measures. The non-GAAP financial measures should be considered in addition to, but not as a substitute for, the information provided in accordance with GAAP. Reconciliations for the non-GAAP financial measures to the most directly comparable GAAP financial measures are provided below. T-Mobile is not able to forecast net income on a forward looking basis without unreasonable efforts due to the high variability and difficulty in predicting certain items that affect GAAP net income including, but not limited to, income tax expense, stock based compensation expense, interest expense and interest income. The Company is making an accounting change in 2017 to include imputed interest associated with EIP receivables in Other revenues which will be included in Adjusted EBITDA.
Adjusted EBITDA is reconciled to net income (loss) as follows:
.jpg)
- Stock-based compensation includes payroll tax impacts and may not agree to stock based compensation expense in the condensed consolidated financial statements. Other, net may not agree to the Consolidated Statements of Comprehensive Income primarily due to certain non-routine operating activities, such as other special items that would not be expected to reoccur, and are therefore excluded in Adjusted EBITDA.
Adjusted EBITDA - Earnings before interest expense, net of interest income, income tax expense, depreciation and amortization expense, non-cash stock-based compensation and certain expenses not reflective of T-Mobile's ongoing operating performance. Adjusted EBITDA margin represents Adjusted EBITDA divided by service revenues. Adjusted EBITDA is a non-GAAP financial measure utilized by T-Mobile's management to monitor the financial performance of our operations. T-Mobile uses Adjusted EBITDA internally as a metric to evaluate and compensate its personnel and management for their performance, and as a benchmark to evaluate T-Mobile's operating performance in comparison to its competitors. Management believes analysts and investors use Adjusted EBITDA as a supplemental measure to evaluate overall operating performance and facilitate comparisons with other wireless communications companies because it is indicative of T-Mobile's ongoing operating performance and trends by excluding the impact of interest expense from financing, non-cash depreciation and amortization from capital investments, non-cash stock-based compensation, network decommissioning costs as they are not indicative of T-Mobile's ongoing operating performance and certain other nonrecurring expenses. Adjusted EBITDA has limitations as an analytical tool and should not be considered in isolation or as a substitute for income from operations, net income or any other measure of financial performance reported in accordance with GAAP.
T-Mobile US, Inc.
Reconciliation of Non-GAAP Financial Measures to GAAP Financial Measures (continued)
(Unaudited)
Net debt (excluding Tower Obligations) to last twelve months Adjusted EBITDA ratio is calculated as follows:

- Long-term debt as of March 31, 2015 through December 31, 2015 has been restated for the adoption of Accounting Standards Update 2015-03, “Simplifying the Presentation of Debt Issuance Costs” in Q1 2016. The impact to the Net Debt (excluding Tower Obligations) to Last Twelve Months Adjusted EBITDA Ratio was not significant.
Net debt - Short-term debt, long-term debt to affiliates, and long-term debt (excluding tower obligations), less cash and cash equivalents and short-term investments.
Free cash flow and adjusted free cash flow are calculated as follows:

Free Cash Flow - Net cash provided by operating activities less cash capital expenditures for property and equipment. Free Cash Flow is utilized by T-Mobile's management, investors, and analysts to evaluate cash available to pay debt and provide further investment in the business.
Adjusted Free Cash Flow - Free Cash Flow excluding decommissioning payments related to the shutdown of the CDMA portion of the MetroPCS network.
Free cash flow three-year CAGR is calculated as follows:

T-Mobile US, Inc.
Reconciliation of Operating Measures to Branded Postpaid Service Revenues
(Unaudited)
The following tables illustrate the calculation of our operating measures ARPU and ABPU and reconcile these measures to the related service revenues:
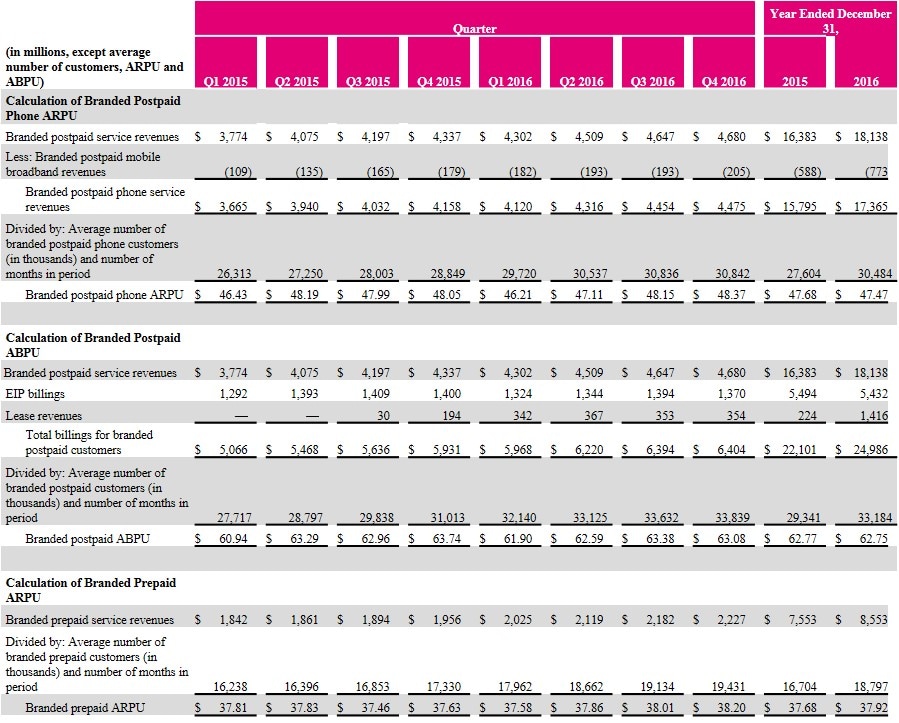
Average Revenue Per User (ARPU) - Average monthly service revenues earned from customers. Service revenues for the specified period divided by the average customers during the period, further divided by the number of months in the period.
Branded postpaid phone ARPU excludes mobile broadband customers and related revenues.
Average Billings per User (ABPU) - Average monthly branded postpaid service revenues earned from customers plus monthly EIP billings and lease revenues divided by the average branded postpaid customers during the period, further divided by the number of months in the period. T-Mobile believes branded postpaid ABPU is indicative of estimated cash collections, including device financing payments, from T-Mobile's postpaid customers each month.